

How to build Smart Cities using Heatmaps from Smart Street Lights?
Cities that understand human movement better can offer more efficient public services as a result. That’s why we created heatmaps. This tool is a perfect example of how the Internet of Things and data-backed analysis help cities prosper and adapt to the needs of their citizens. Here’s how heatmaps generated from smart street lights work and how you can use them to your best advantage.
One key factor that accounts for the popularity of smart street lighting is its positive effect on the city’s energy use. By ensuring there’s only as much light as it is necessary–what we call the “light on demand” technology–smart street lights slash the electricity consumption without compromising public safety. This is possible thanks to the in-built motion-sensing capabilities of the wireless outdoor lighting controllers.
And even though the smart lighting technology has been around for quite some time, its true potential is just beginning to show, opening many doors to new applications. Did you know that motion-sensing smart street lights can also help you allocate resources, ease traffic jams, and spur the local economy too? These new benefits are possible thanks to features like Tvilight heatmaps.
What is a heatmap?
Heatmaps are graphical reflections of the occupancy levels and traffic intensity at certain locations. At Tvilight, we create heatmaps using the data gathered by Tvilight CitySense street light motion controllers. We start with raw data on the human presence and end up with clean illustrations that are easy to use and instantly understandable.
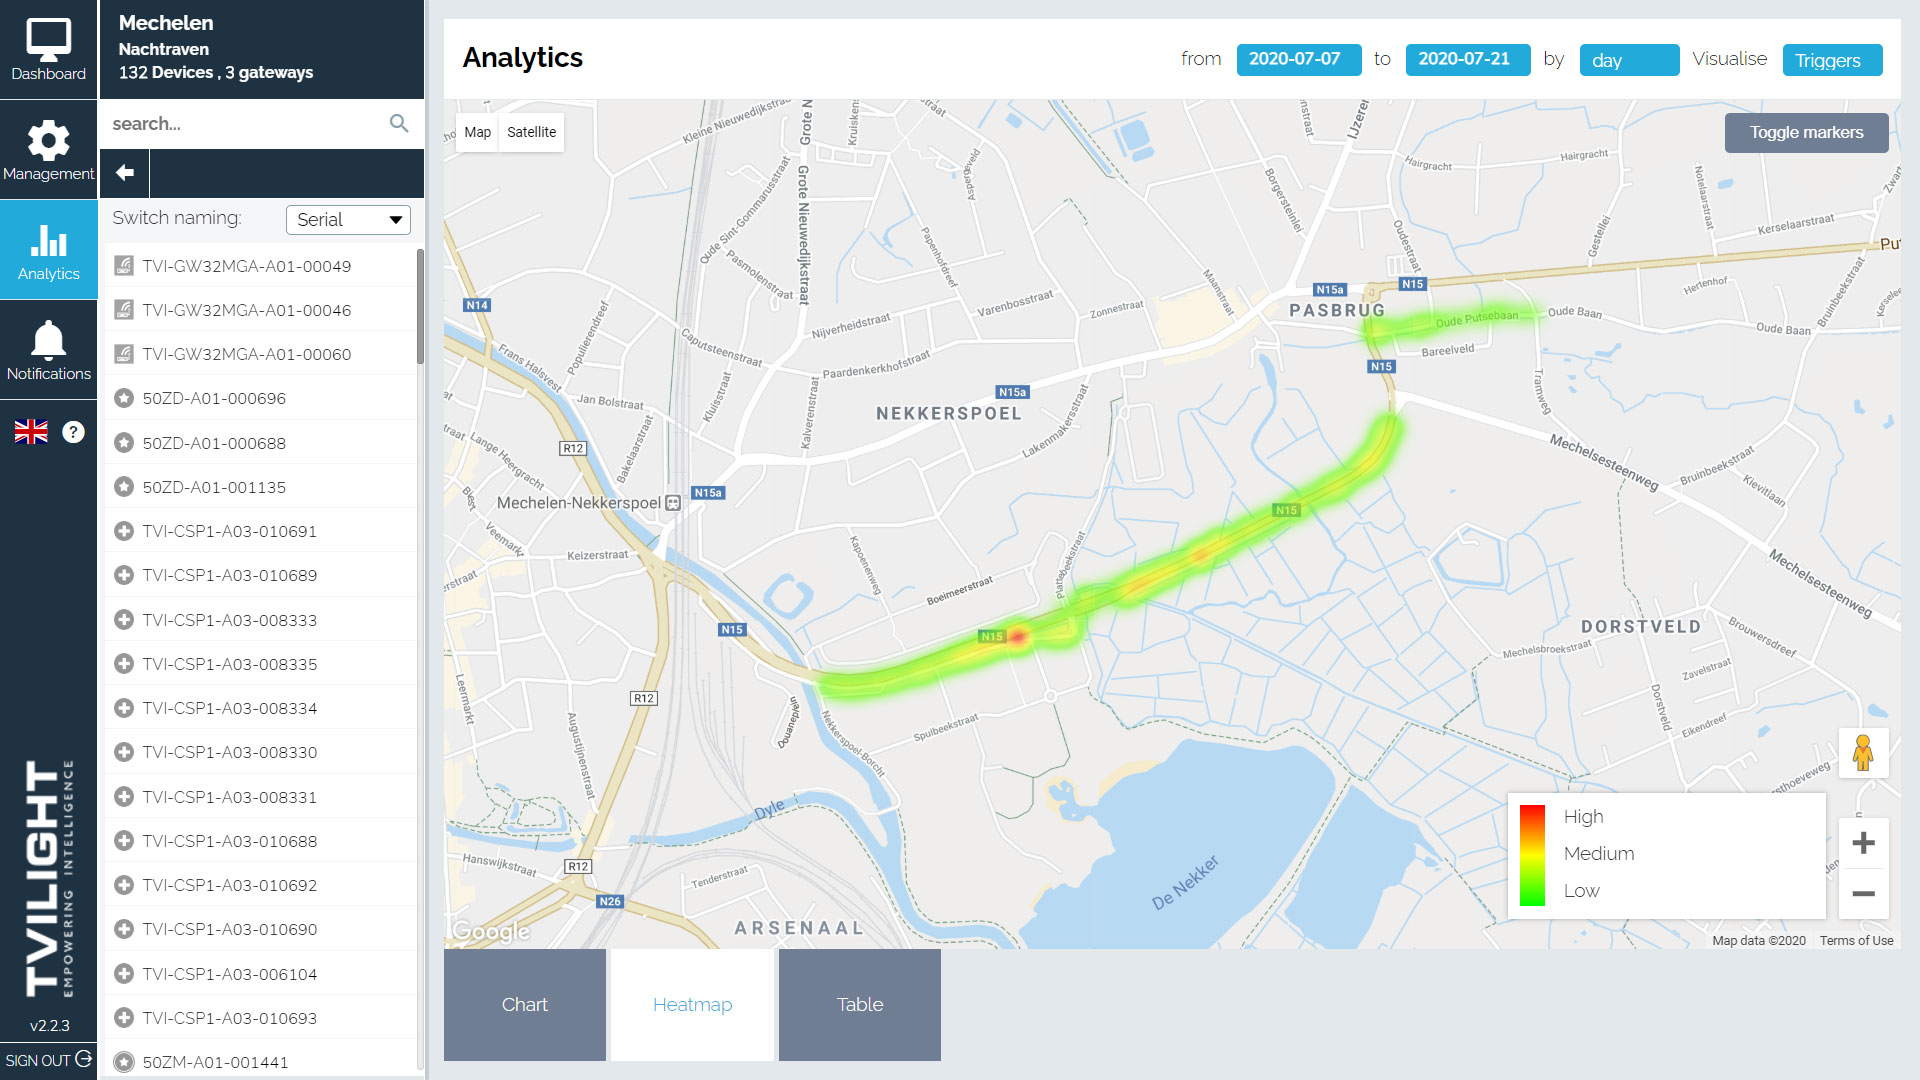
On the screenshot below (taken from the dashboard of CityManager software), one can see that the areas were attributed different colors, depending on the presence of humans and vehicles that the sensors were registering there. The busiest locations are marked red; the areas with the lowest occupancy appear in green. With heatmaps, you can pinpoint the busiest locations at one glance.
What can you do with heatmaps?
Understanding human movement is a powerful tool. It can help you conduct large infrastructure projects and maintain existing facilities. Knowing how humans and vehicles move, municipalities can also ensure better traffic conditions through more efficient planning and budgeting. Heatmaps display the locations where people and vehicles tend to accumulate most and can deliver a range of unexpected benefits to the municipalities, infrastructure operators, businesses, and advertisers.
Better road conditions
No one likes being in a traffic jam. However, this unpleasant phenomenon is part of the daily lives of the majority of urban dwellers. The TomTom Traffic Index shows that congestion levels in cities like Istanbul or Bucharest peak over 50% during the evening rush hour, meaning that the journey time increases by more than 50% compared to what is necessary when the roads are clear.
While no immediate solution to traffic jams exists, a few steps can be taken to help cities work around the problem. One way to deal with traffic jams is to increase road capacity through reconstruction, which can be costly and sometimes simply impossible. A better option would be to redirect the traffic from the crowded streets by encouraging drivers to take alternative routes. This is not possible without studying the traffic on different roads first and identifying the bottlenecks. Heatmaps help you to do just that.
Adequate resource allocation
Heatmaps are also great for cities that would like to evaluate the infrastructure conditions better. For instance, by assessing the number of vehicles passing through a particular route during a year, cities can predict which routes might need maintenance most. This helps prioritize infrastructure expenses, allocate the budget correctly, and plan the roadworks. The Federation of Canadian Municipalities reports that the local municipal infrastructure tends to age rapidly because of inadequate investment and maintenance. Although data from heatmaps won’t solve the whole issue, it would give the authorities a leg up in the planning process.
Safer and cleaner cities
Money is not the only resource that can be better-allocated thanks to heatmaps. Seeing which areas experience the largest crowds and which streets are busiest, cities can identify new opportunities for the allocation of police resources (strategically locate the police close to the largest gatherings) and even better cleaning of the public areas (timely emptying the garbage bins that have a higher chance of overflowing).
Value for businesses and advertisers
Furthermore, if you are an advertiser or would like to open a local business, heatmaps have something for you too. Choosing the location for a new cafe or hotel can be intimidating because this choice often defines the success of the business. However, this decision becomes less tricky once you know where the people tend to go and where they tend to group. Same for advertisers–by knowing where the crowds are, these parties can place the billboards strategically, gathering more public attention and views.
Heatmaps are a great example of how the Internet of Things and Big Data translate into tangible, everyday action steps that improve our lives.